A website redesign pays off when the extra profit from new enquiries or orders covers its full cost within a set period, usually a year. You can work this out before you sign the quote: you need your monthly number of enquiries, the share that turn into contracts, the average deal and your profit margin. For example, if one enquiry brings in 176 € of profit on average and the redesign costs 4700 € including your own time, it has to bring in a little over 2 extra enquiries a month. After launch, track the same metrics for 60-90 days and compare them with the same period last year, so that seasonal demand is not counted as a redesign result. If the site gets few visitors, or customers leave because of price or slow replies, a new design will not change the number of enquiries. This article was written on 12 November 2026.
What it means to prove the return on a redesign
On 11 September 2026 Smashing Magazine published an article by Alex Williams on defending a UX investment in front of management. His core point: a design idea does not win budget on its own. You need evidence that the change moves a business result, and that evidence has to survive sceptical questions. Williams puts it simply: “Speak in outcomes rather than outputs.”
Four of his principles work for a small business too:
- set goals and metrics before work starts, together with the person responsible for the result;
- count the full cost, including the time the owner and staff spend on copy, approvals and training;
- show cause and effect, not just timing that happens to line up. Where an A/B test is impossible, a time series with measurements taken before the change will do;
- write down everything else that changes at the same time (ads, prices, season), and decide what share of any growth you will credit to the redesign before the results are in.
The article describes a software company with thousands of trial accounts, where users can be split into two groups. A Latvian business with 20 enquiries a month cannot run that kind of test, but anyone can compare with last year and keep a note of what changed alongside the redesign.
Treat averages from studies with care. In 2020 Nielsen Norman Group researcher Kate Moran compared UX case studies: in 2006-2008 the average improvement in metrics was 247%, in 2020 it was 75%, and half of the results fell between 13% and 157%. The biggest usability problems on the web have largely been fixed, so the gains are getting smaller. “Plus 75% on average” is not a forecast for your site. Your forecast can only come from your own numbers.
Which numbers to collect before a redesign
Take the last 12 months, month by month, because that is the only way to see seasonality. Search Console shows 16 months of data and drops anything older, so export it now and keep it in a spreadsheet.
- Enquiries or orders per month: forms, calls, emails and WhatsApp, each source separately.
- Close rate, average deal and margin: how many enquiries become contracts, the average value excluding VAT and the profit share after materials and labour.
- Conversion rate: enquiries or orders per visit, separately on mobile and desktop. In GA4 you will find this under key events by device category.
- Share of mobile visitors. If it is above 60%, judge the site on a phone first.
- LCP and INP from real-user data: the Core Web Vitals report in Search Console or the top section of PageSpeed Insights. A good LCP is up to 2.5 s, a good INP up to 200 ms. Why a page can load quickly and still feel slow is covered in our article Your site loads fast but feels slow.
- Google positions and clicks for your 10-20 most important pages from the Search Console pages report, plus a list of every current URL from the sitemap. This becomes the basis of your redirect map.
- Calls: your phone provider’s call log, calls from your Google Business Profile and clicks on tel: links.
- Response time: how many hours pass before a customer gets a reply to a form enquiry.
In the same spreadsheet, note what else will change during the redesign: ad budget, prices, a new service, a new employee. Without this list, three months later you will not be able to say what actually caused the growth.
How to calculate the break-even point
The break-even point is the number of extra enquiries per month at which the redesign earns back its cost within the period you choose. It takes two calculations:
- Profit per enquiry = average deal × profit margin × close rate.
- Break-even = total redesign cost ÷ (profit per enquiry × number of months).
Include the quote (excluding VAT if you are VAT-registered), copy and photos, your own time and any difference in monthly costs if the new site needs different hosting or maintenance. Choose the number of months before you calculate. For a small service business 12 months is a sensible period, because after a year prices and the offer on the site usually change anyway.
For an online shop the formula is the same, with orders instead of enquiries. Suppose a shop has 6000 visits and 90 orders a month (1.5% conversion), an average basket of 65 € and a 25% margin after delivery and fees, which is 16.25 € per order. A 6500 € redesign pays back within a year with 33 extra orders a month. Conversion would have to reach 2.06%, an increase of 37%. Baymard Institute estimates a similar possible gain (35.26%) for large online shops from checkout improvements alone, so a target that high is realistic if the checkout has serious problems. If the checkout already works well, such a target is unrealistic, and it is better to split the work into stages or plan for a longer payback period.
A break-even figure also gives you a target for the quote. If you know you need 2 extra enquiries a month, you can discuss with the developer which parts of the site will deliver them.
Example: a heating installer in Jūrmala
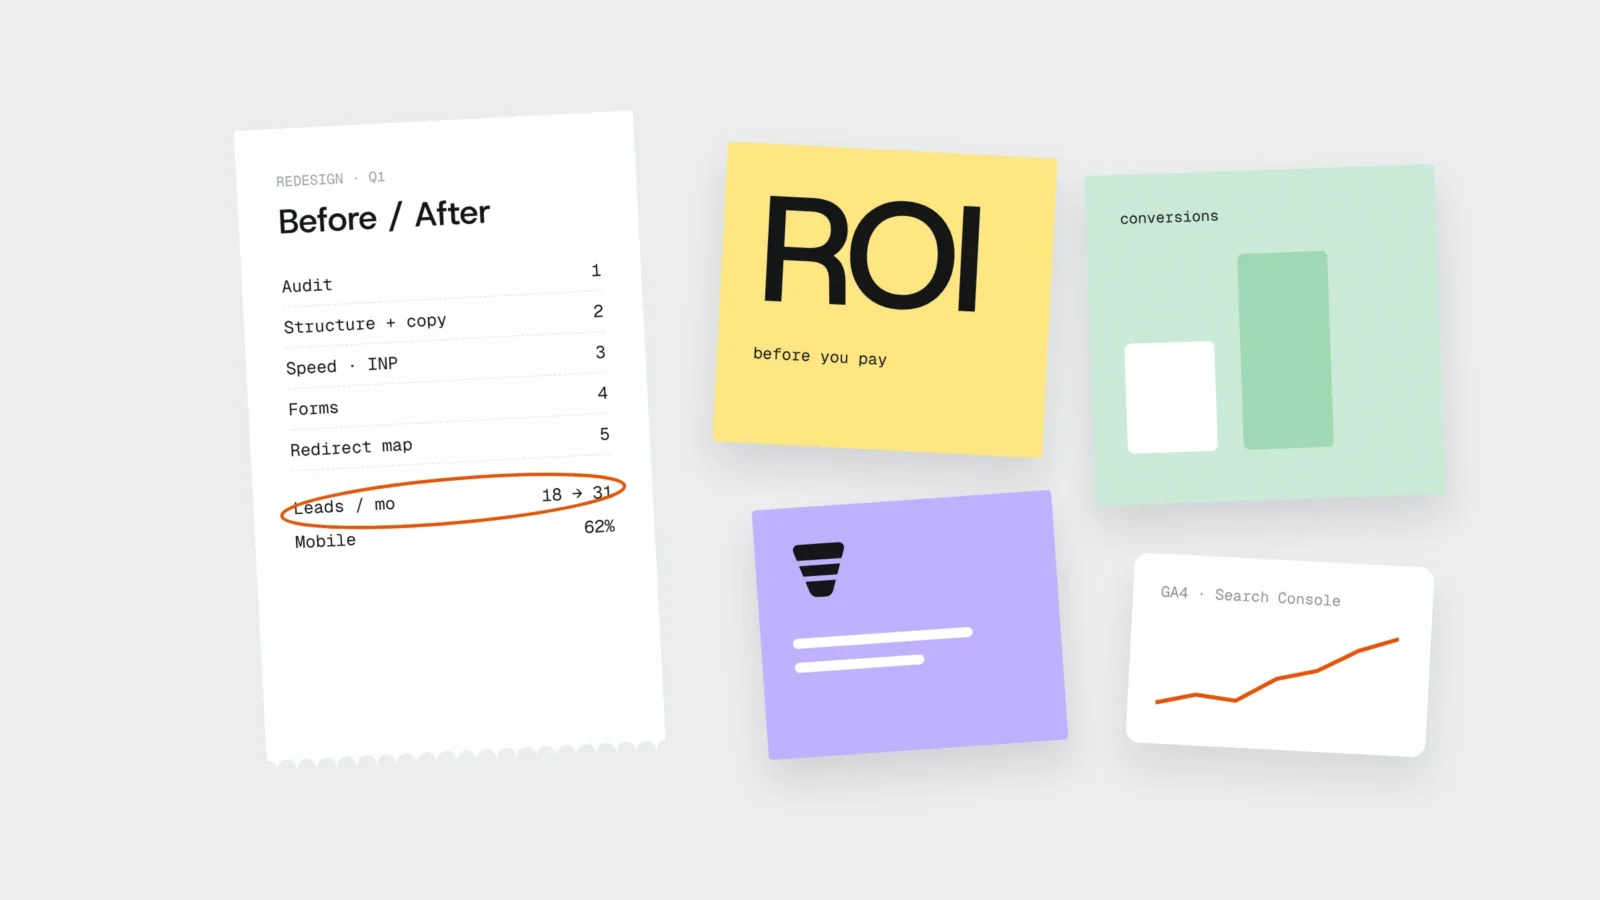
Suppose a five-person company in Jūrmala installs heat pumps and gas boilers in private houses in Jūrmala and the Riga area. The old site dates from 2019. In May-July 2026 it brought in an average of 18 enquiries a month: 7 forms and 11 calls. The company signs a contract with every third enquirer, the average deal is 2400 € excluding VAT and the margin is around 22%.
Before asking for a quote, the owner collects the other numbers. 72% of visitors come from phones. On mobile 0.3% of visitors fill in the form, on desktop 1.0%. The Core Web Vitals report in Search Console shows a mobile LCP of 4.6 s and INP of 410 ms. Three pages (heat pump installation, boiler replacement and prices) bring 61% of Google clicks, with an average position of 5.8.
Break-even point
- profit per deal: 2400 € × 22% = 528 €;
- profit per enquiry: 528 € ÷ 3 = 176 €;
- cost: a redesign quote of 4200 € excluding VAT plus about 20 hours of the owner’s time on copy and approvals, which he values at 500 €, 4700 € in total;
- break-even: 4700 € ÷ 176 € = 27 extra enquiries a year, a little over 2 a month.
Two extra enquiries on top of 18 is a 12% increase. The numbers also show the main problem: the form works three times worse on mobile than on desktop, and most visitors come from phones. Before launch the owner writes down what will change in parallel: the Google Ads budget stays at 250 € a month, prices stay the same, and new photos will be added to the Google profile in September. He also decides that only enquiries above the seasonal expectation will be credited to the redesign.
After 90 days: 31 enquiries in October
The new site went live on 4 August with a 301 redirect for each of the 52 old URLs. August brought 21 enquiries, September 25 and October 31. Compared with 18, that looks like +72%, but for a heating company October is the seasonal peak, because people think about heating when it gets cold. Last year the same months brought 17, 20 and 24 enquiries, 61 in total, with an average of 16 a month in May-July.
One calculation separates out the season. This year’s baseline is 12.5% higher than last year’s (18 against 16), so without the redesign you could expect around 61 × 1.125 = 69 enquiries in August-October. The actual figure was 77. Around 8 enquiries over three months, roughly 2.7 a month, can be credited to the redesign. That is above break-even: 8 × 176 € = 1408 € of profit in three months.
Eight enquiries are not yet proof. With around 20 enquiries a month, a swing of 4-5 either way is normal (statistically it is roughly the square root of the count). So the owner also looks at metrics that react faster and are less affected by the season:
- on mobile 0.9% of visitors now fill in the form (previously 0.3%), on desktop 1.1% (previously 1.0%);
- mobile LCP is 1.8 s, INP 140 ms;
- the three key pages hold an average position of 5.5, and clicks are up 34%, against 29% in the same months last year. Most of the traffic growth is seasonal, but no rankings were lost in the rebuild;
- 77 enquiries led to 25 contracts (32%), so enquiry quality has not dropped.
The extra enquiries come from the mobile form that the slow site used to hold back, which matches what the redesign changed. The owner will make the final call in February, after comparing November-January with the same period last year. If growth above the seasonal level stays at around 2 enquiries a month, the redesign will pay for itself within the first year.
How to measure the result after launch
Measure the same metrics with the same tools and definitions you recorded before the redesign. If the old site counted forms and calls as enquiries, do not add chat conversations on the new one. Otherwise the growth is only a change in counting.
- 60-90 days. In the first 2-4 weeks Google reindexes the new URLs. Google itself says rankings fluctuate temporarily during a move and that for a small or medium-sized site most pages move within a few weeks. After that you need at least two more full months.
- Comparison with last year. Calculate the expected figure without the redesign: last year’s enquiries for the period × (this year’s baseline ÷ last year’s baseline). Credit only the difference to the redesign.
- Fast indicators. LCP, INP, mobile conversion and form submissions change immediately after launch, enquiries and contracts later. If the fast indicators do not improve, the growth in enquiries is most likely seasonal.
- Enquiry quality. Count contracts too. A site with a lower barrier can bring more price enquiries, few of which become deals.
- Google rankings. Your redirect map needs a 301 redirect from every old URL to the closest new page. Google recommends keeping redirects for at least a year. During the first month, check 404 errors and the positions of your key pages in Search Console every week.
- Google updates. Check the Google Search Status Dashboard for core updates during your measurement period. The November 2026 core update started on 10 November, so sites launched in November may see ranking swings caused by it.
If some enquiries come from AI assistants or people call without opening the site, clicks show only part of the picture. How to count enquiries by source is covered in our article Fewer clicks from Google: what a small business should measure in AI search.
When a redesign will not pay off
Low traffic. If a site gets 300 visits and 2 enquiries a month, even 50% growth is one enquiry, and you cannot tell it apart from chance. In that case you need visitors first: SEO, a Google Business Profile or ads. A redesign can help later, once more people find the site.
The problem is the offer or the price. If visitors open the price page and leave, or calls come in but few turn into contracts, a new design will not fix it. In Baymard Institute’s survey, 40% of US shoppers who abandoned a purchase named extra costs that were too high (shipping, taxes, fees). Design can show the total price earlier, but it cannot make the offer cheaper.
Slow replies. A study published in Harvard Business Review in 2011 concluded that most companies respond to online enquiries far too slowly. Test yourself: fill in your own form on a weekday afternoon and note how many hours it takes to get a reply. If the answer arrives the next day, some of the extra enquiries from the new site will go to a competitor.
A single, specific fault. The form does not send email, the phone number is not clickable, the price page is unreadable on a phone. That is a few hours of fixes on the existing site. What to check before bigger work is covered in our article What to improve on your website: 10 things to start with.
Checks before you sign the quote
- Spreadsheet. Enter the last 12 months of enquiries or orders by month and by source.
- Profit per enquiry. Calculate average deal × margin × close rate.
- Break-even. Divide the total cost by profit per enquiry and the number of months. Write the result down as your target.
- Mobile. Compare conversion on mobile and desktop and note LCP and INP from real-user data.
- Google. Export 16 months of Search Console data and a list of all URLs for the redirect map.
- Reply test. Fill in your own form and measure the response time.
- Parallel changes. Write down what will change during the redesign and decide how you will judge the result before you know it.
What to do before a redesign
- Put 12 months of enquiries by source into a spreadsheet.
- Calculate profit per enquiry and the break-even point.
- Note mobile and desktop conversion, LCP and INP.
- Export Search Console data and a list of all URLs.
- Fill in your own form and measure the response time.
- Write down what will change alongside the redesign.
Frequently asked questions
How long should a website redesign take to pay for itself?
For a small service business, 12 months is a sensible target. Choose the period before you calculate and use it to work out how many extra enquiries a month you need. If a year would require more than 30-40% growth, plan the work in stages or allow a longer period.
How do I calculate how many extra enquiries a redesign needs to pay off?
Profit per enquiry is average deal × margin × close rate. Divide the total redesign cost, including your own time, by that profit and the number of months. For example, 4700 € ÷ (176 € × 12) is a little over 2 extra enquiries a month.
How long should I wait after a redesign before judging the result?
At least 60-90 days. In the first 2-4 weeks Google reindexes the new URLs and rankings may fluctuate. Fast indicators (LCP, INP, mobile conversion) change straight away, but judge enquiries and contracts over full months and again after six months.
How do I separate seasonal effects from the effect of the redesign?
Compare with the same period last year. The expected figure without the redesign is last year’s enquiries × (this year’s baseline ÷ last year’s baseline). Credit only the gap between actual and expected to the redesign, and check whether metrics the season barely affects, such as mobile conversion, improved too.
Can Google rankings drop after a website redesign?
Yes, if URLs change and the old pages have no redirects. Before work starts, build a redirect map with a 301 from every old URL to the closest new page, keep copy that already ranks, and check Search Console every week for the first month. Google recommends keeping redirects for at least a year.
When should I improve the existing website instead of redesigning it?
When the problem is specific: slow loading on mobile, a broken form, unclear prices or weak copy on key pages. These can be fixed on the current site. A redesign makes sense when the structure and technology no longer allow these fixes or the business offer has changed substantially.
An audit with your numbers before a redesign quote
In our website audit we check speed, SEO, AI visibility, design and conversion within 5 working days of receiving access. Each finding is marked “fix now”, “in the redesign” or “can stay”, and you get the quote together with the action plan. If a redesign goes ahead, we build the redirect map before the first sketch and check Search Console positions and clicks every week for the first month after launch. Send us your site address and monthly number of enquiries or call +371 25 640 062, and before the audit we will calculate how many extra enquiries your redesign would need to bring in.
Sources
- Smashing Magazine, Alex Williams: Building A UX ROI Case That Survives The Boardroom (11.09.2026)
- web.dev: Milliseconds make millions (Google, 55 and Deloitte)
- Deloitte: Milliseconds Make Millions (full report, PDF)
- Baymard Institute: Cart Abandonment Rate Statistics (updated 28.10.2026)
- Nielsen Norman Group, Kate Moran: Average UX Improvements Are Shrinking Over Time (01.11.2020)
- Google Search Central: Site moves with URL changes
- Google Search Central: Debug Google Search traffic drops
- Google Search Status Dashboard
- Harvard Business Review, Oldroyd, McElheran, Elkington: The Short Life of Online Sales Leads (2011)